By Debanjan Mitra and Peter N. Golder
Quality might be the most important factor underlying the long-term success of products and firms. The business press routinely cites quality as the cause of firm success and failure. However, it is now well established that it is not quality per se but rather customers’ perceptions of quality that drive preferences and, ultimately, satisfaction, loyalty, sales, and profitability.
Of course, numerous anecdotes suggest that customer perceptions of quality do not reflect objective quality. Companies frequently find that negative perceptions persist even after products perform well in quality tests. Still, many researchers believe that customer perceptions of quality do respond to changes in quality and that quality changes are apparent to consumers only in the long-term. For example, while Toyota is currently reaping the benefits of higher perceived quality, it took many years for customers to recognize its quality advantage over US automakers. Similarly, it took Google three years after its launch to be perceived as the superior search engine.
 It is crucial for managers to understand these lagged customer perception processes. So we set out to examine how the objective measures of quality and perception of quality are linked over time for different products. We did so by collecting and analyzing time series of quality and perceptions of quality across many product categories, constructing a model, and then testing several hypotheses.
In our study, objective quality is operationalized as a composite of instrument measures and expert ratings on multiple vector product attributes (i.e., those attributes for which customers prefer either a higher or a lower magnitude). For example, a personal computer’s objective quality attributes include processing speed, hard disk capacity, reliability, and features like the modem. Objective quality does not include intangible attributes like aesthetics and extrinsic attributes like brand image or salesperson behavior.
Perceived quality is the overall subjective judgment of quality relative to the expectation of quality. These expectations are based on one’s own and others’ experiences, and on sources including brand reputation, price, and advertising. It is not necessary to use or examine a product to form perceptions of quality.
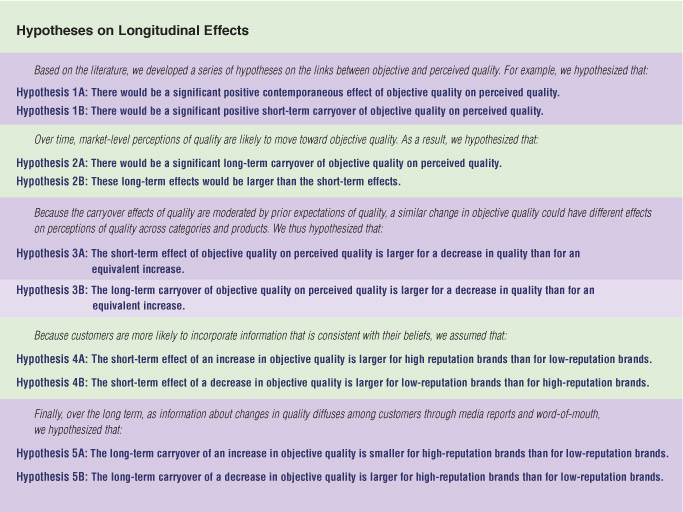
Objective quality affects customer perceptions of quality in several ways. The contemporaneous effect is the impact of objective quality on perceived quality in the current time period (i.e., the same year). The short-term effect is the impact of objective quality on perceived quality in the current and subsequent time period (i.e., same year plus one year later). Short-term carryover refers to the difference between the short-term effect and the contemporaneous effect. The long-term effect is the cumulative effect of objective quality on perceived quality over an infinite time horizon. Long-term carryover is the difference between the long-term effect and the short-term effect. And carryover duration is the time needed to reach a pre-specified percentage of the long-term effect.
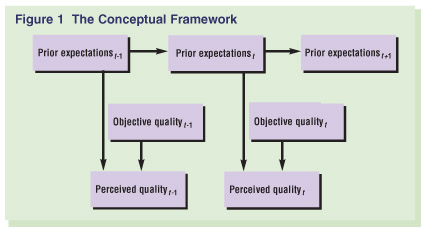 Most marketing studies on brand choice assume that quality is constant over time. However, companies usually make numerous changes to a product over time, through changes in design, raw materials, features, and production processes. Perceived quality, in turn, is affected not only by these changes in objective quality but also through changes in customer’s expectations of quality. Figure 1 presents the relationships among these variables.
Model and Data
We constructed a model (the details of which can be seen in our article in Marketing Science) and assembled longitudinal data on objective quality and perceived quality from several sources. For perceived quality, we used the Equitrends data of Total Research Corporation (TRC), which surveys more than 30,000 people each year and asks them to evaluate the quality of products on a zero to 10 scale. The data included ratings on 280 products between 1989 and 1994 and 1,000 products between 1995 and 2000.
For objective quality, we used quality ratings from Consumer Reports, one of the most elaborate and well-respected quality rating systems in the world. We identified 53 product categories that Consumer Reports tested four or more times between 1989 and 2000. We also identified 52 “high-reputation brand” products in our dataset based on the BusinessWeek rankings of top 100 brands during 2000 and 2001.
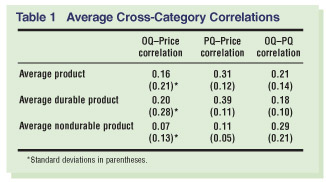
In addition to our data on quality, we collected annual product-level data for price (from Consumer Reports), advertising (from Leading National Advertisers), and market share (from Market Share Reporter). In the end, we had a time series of 241 products in 46 product categories for periods ranging from six to 12 years. Overall, the data include 1,926 observations on objective quality and perceived quality, plus several other important variables including price. In Table 1 we report the correlations of these variables over time. Across products in all categories, we found that the price-objective quality correlation is 0.16. The correlation for durable products in our data is 0.20 and for non-durables is 0.07. In the past, researchers examined these cross-sectional correlations and inferred imperfect markets. However, these correlations do not take into account the longitudinal relationship (i.e., lags in the perception processes).
Findings
What did we find about the longitudinal relationship?
First, we found statistically significant contemporaneous effects, short-term effects, and long-term effects of objective quality on perceived quality. These results support Hypothesis 1A, Hypothesis 1B, and Hypothesis 2A. In other words, improving the quality of a product, as measurable by objective means, does help improve a product’s reputation. While the significance of the effects is comforting, it is more interesting to consider the relative size and carryover duration of the effects. Specifically, the contemporaneous effect on perceived quality is about 10 percent of the change in objective quality and constitutes, on average, 19 percent of the long-term effect. Also, the short-term effect constitutes about 35 percent of the long-term effect, resulting in a carryover duration that is between five and eight years. This means the size of the long-term carryover is greater than the size of the short-term effects. So while boosting quality can pay dividends in the short-term, it pays even larger dividends over the long-term. This result supports Hypothesis 2B.
 Our results also show that when it comes to quality, companies do get punished if quality is perceived to slip. When we examined 54 products whose quality increased and 49 products whose quality decreased, we found that a relative decrease in quality has a larger short-term effect than a relative increase in quality, thus supporting Hypothesis 3A. But the long-term carryover of a decrease in quality turned out not to have a significant effect, so we did not find support for Hypothesis 3B.
The results also point to certain advantages enjoyed by products that have already built reputations for quality. For the 52 “high-reputation” products in our data, those that managed to increase the objective measure of quality had significantly positive short-term effects on perceived quality, thus supporting Hypothesis 4A. But when the objective quality of these high-reputation brands slipped, there was not a significant short-term effect on perceived quality. We also found that the long-term carryover is significantly smaller for high-reputation brands that are increasing in quality, thus supporting Hypothesis 5A. On the other hand, the long-term carryover is larger for high-reputation brands that are decreasing in quality, thus supporting Hypothesis 5B.
These findings provide support for an important asymmetry between high-reputation products and lower-reputation products. In a sense, it is easier for the rich to get richer. High-reputation products have larger short-term returns for increases in quality, but are not penalized more for decreases in quality in the short-term. Such asymmetry is also reflected in the carryover duration. High-reputation products are rewarded three years sooner for an increase in quality and penalized one year later for a decrease in quality. This provides an additional four years of reaction time for the high-reputation products in our data.
Implications
Our findings have several implications for managers and researchers, beyond providing strong rationale for managers to track both objective quality and perceived quality over time. First, our study shows that substance can matter more than image. Throughout, we found that objective quality drives customer perceptions of quality. Second, the asymmetry of time lags between different brands throws new light on the differential advantage of brand reputation. Our results show that extra benefits accrue to high-reputation brands. They have larger short-term returns for increases in quality but are not penalized more for decreases in quality in the short-term.
"Our study shows that substance can matter more than image. Throughout, we found that objective quality drives customer perceptions of quality." |
Perhaps more significant, our study suggests that a strategy for improving objective quality, which may focus on manufacturing processes, can’t simply be viewed in isolation from a marketing strategy that tries to heighten a product’s perceived quality. Rather, a product’s quality strategy must be integrated with its marketing strategy. And the links show that companies can’t simply choose a single broad quality strategy. After all, we found that lower-priced products have relatively higher short-term effects of quality than higher priced products, particularly for increases in quality. As a result, the same improvement in quality that is profitable for one product may be unprofitable for another product because of a different lag structure.
The study has important implications for how we regard both the ways in which actual quality and customer perceptions of quality can change over time. It is tempting to view the images of well-known products as being fixed in customers’ minds. But we found that significant changes in quality have occurred during the period of our study. And it appears that customers are learning about past changes in quality even as current changes are taking place. Thus, even though customers don’t always behave efficiently, the very fact that customers do learn creates a force promoting quality competition.
And just as customer attitudes toward products are constantly evolving, so too are products. Earlier studies found that about 30 percent of products in “mature” categories have evolving market shares, even though they do not have evolving marketing expenditures. Our results suggest that such evolution may be due to continuous changes in quality.
Finally, our study has important implications regarding the sustainability of competitive advantages. Analysts frequently wonder whether any advantage can be sustained in today’s fast-changing environment. This study shows that asymmetries and lags in customer perceptions of quality can provide products with some limited sustainability. Smart companies can build on this sustainability by using their time advantage to attack as well as defend.
Debanjan Mitra (MPhil ’00, PhD ’03) is a graduate of NYU Stern and currently assistant professor of marketing at the Warrington College of Business Administration, University of Florida, and Peter Golder is George and Edythe Heyman Faculty Fellow and associate professor of marketing at NYU Stern.
This article is adapted from an article that appeared in Marketing Science, May-June 2006.